Using ML models to improve monitoring of PD's patients - Part 2
Machine Learning
Machine learning has gain massive popularity in the last few decades. Many popular applications uses machine learning to help companies do things that couldn’t be done before. For example, Netflix’s movie recommendation, Email’s spam identifier, Siri’s virtual personal assitants. This also include hospitals use ML to identify lung cancer using image recognition.
ML is mainly seperated into 2 groups – Classification and Regression.
- Classification predicts a discrete class label. For example identifying if the given image is a dog or a cat.
- Regression on the other hand predicts a continuous quantity. For example predicting house prices given a certain location.
Linear vs Polynomial Regression
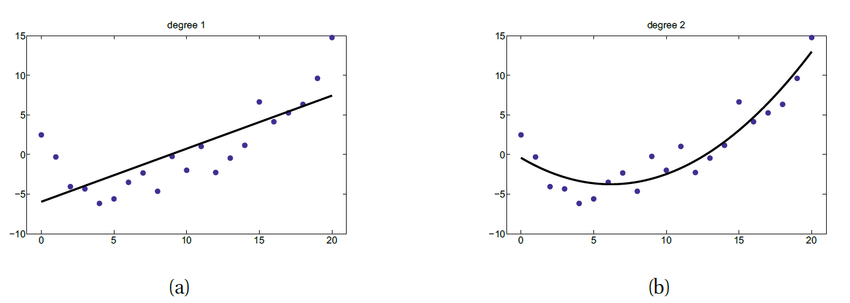
Linear Regression is the simplest regression model. It uses the equation of a straight line y = a + bx + e to map out the data set and identifies the line of best fit.
- y : the dependent variable (output)
- x : the independent variable (input)
- a : the y-intercept
- b : the gradient or slope
- e : the error rate
Polynomial Regression is another regression model, similar to linear regression but predicts the curve of best fit. The general equation is y = a + b1x + b2x^2 +....+ bnx^n , in which the relationship between the independent variable x and dependent variable y is modeled as an nth degree polynomial. The higher the nth degree, the more accurate the curve will be corresponding to its datapoints.
For this project, I’ve decided to use Polynomial Regression model to identify the user’s greatest average vibration value from different time period. Reason being my datapoints do not show an obvious correlation between the x and y-axis, polnomial fits wider range of curvature and more accurate prediction. However, they are very sensitive to outliers, if there are one or two anomaly datapoints, it will affect the result of the graph.
Application
Another important feature that ML needs is data. In order to have a precise and accurate prediction, they need many many training and testing data.
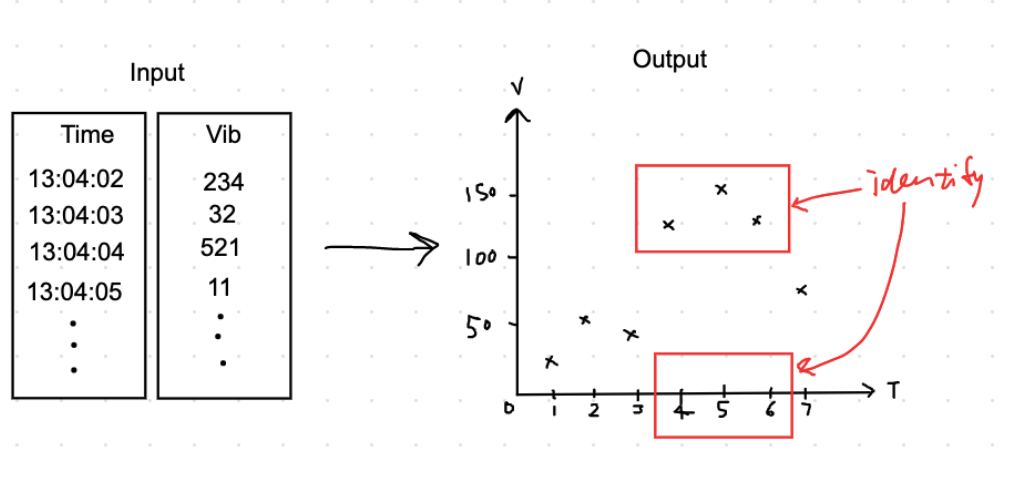
I have drew this simple diagram out to visualize what I’m planning to do with my input datasets (the vibration value I’ve collected with the Nung device). Here is what I did with the dataset:
- Export dataset into CSV (so the python model can use it)
- Use polynomial regression model to draw a near-accurate curve
- Identify the max-points of the graph
- Find the coordinates of the max point (time, vibration_value)
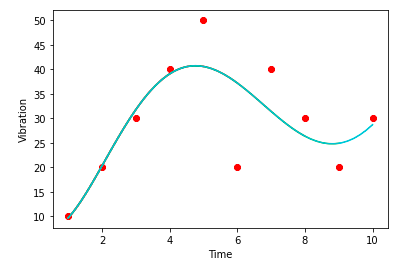
x_axis = numpy.linspace(x[0], x, 50) # range, generation y_axis = numpy.poly1d(numpy.polyfit(x, y, 5)) # draw x y, 5 nth terms
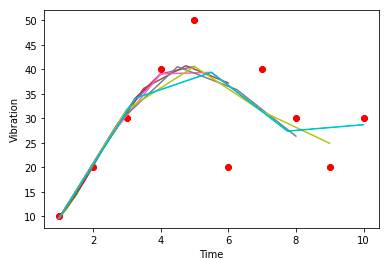
I have used jupyter notebook and python to draw this polynomial regression. As you can see both graph return the same datasets and curve of best fit, however the graph on the right is more accurate because it has higher nth term and generation.
This Upcoming Month… (Last month)
- User Test
- Attach lithium polymer battery to achieve wireless connectivity
- Debugging
- Complete Demo
- Thoughts about the project
A kind reminder: this product is not FDA approved, nor professionally made. It’s just me being bored.
Please subscibe to my monthly blog to get the latest updates.
Thanks for reading 👀. There will be a monthly blog every month on the first week of Friday, Stay Tuned.😉